
KPIs are the critical metrics that indicate an organization's overall health and viability. They measure what is important to the business's success. Each KPI must have the following attributes:
- They must be measurable, for example "Business on the Books" is measurable
- They must have a goal, such as "Business on the Books" will be 10% over last year
- They must be distributed to all stakeholder
- They must have a visual represented status, such as Green could mean meeting goal
- They must have a Trend Direction, for example you could be meeting the goal but the trend is down
For a KPI to be of value there must be a way to accurately define and measure that KPI. In media, advertising and Telco corporations, measurement can only be accomplished through a data warehouse that captures the various media transactions (proposals, sales, inventory, schedules, programming, transmission).
With the BIAnalytix system installed, it is possible to present KPIs and other actionable intelligence (analysis) from this data in real-time. The Decentrix KPI analysis is provided using formulas that accurately and consistently defines each KPI corporate wide. This analysis often results from "crunching" billions of totals that are presented to executives in sub-second response time.
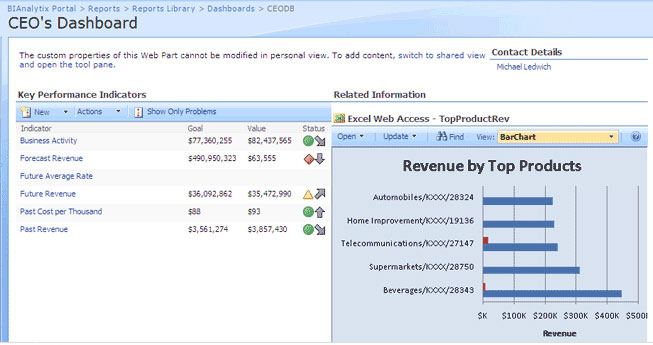
An example of how KPIs might be used is the CEO's Dashboard shown below. It provides key metrics to the CEO on the health of the business specifically utilizing KPIs that have been defined as agreed performance metrics for the corporation:
Below we have provided a few examples of media corporation KPIs through the Decentrix BIAnalytix media Data Warehouse and Business Intelligence system - MBI™: They are not exhaustive by any means and the examples are traditional media specific but they do give some insights into the value of these definitions.
Past Revenue KPI
This KPI is the "gross revenue for the last 3 fiscal calendar months" compared to the "same 3 months of last year" expressed as a percentage. The KPI Goal can be set to a value such as 115% (representing a 15% growth of revenue). A trend is also reflected where the trend is against the KPI of one month before (stable, increasing, decreasing).
Future Revenue KPI
This KPI is the "gross revenue for the next 3 months of the fiscal calendar" compared to the pacing position on the "same day last fiscal year for the corresponding 3 months" expressed as a percentage. The KPI Goal can be set to a value such as 115% (representing a 15% growth of revenue). A trend is also reflected where the trend is against the KPI of one month before (stable, increasing, decreasing).
Business Activity KPI
This KPI is the "revenue booked during the last 4 weeks" compared to the corresponding "4 weeks of the last fiscal year" expressed as a percentage. The KPI Goal can be set to a value such as 115% (representing a 15% growth of revenue). A trend is also reflected where the trend is against the KPI of one week before (stable, increasing, decreasing).
Future Average Rate KPI
This KPI is the "average 30 second equivalent spot rate for the next 3 months" compared to the corresponding "3 months of last year" expressed as a percentage. The KPI goal can be set to a percentage such as 115% (representing a 15% growth of revenue). A trend is also reflected where the trend is against the KPI of one month before (stable, increasing, decreasing).
Past CPT KPI
This KPI is the "average cost per thousand for the past 3 months" compared to the corresponding "3 months of last year" expressed as a percentage. The KPI goal can be set to a percentage such as 115% (representing a 15% growth of revenue). A trend is also reflected where the trend is against the KPI of one month before (stable, increasing, decreasing).
Forecast Revenue KPI
This KPI is the "forecast revenue for the next 3 months based upon the current bookings plus the unsold availability times the average rate achieved". It is compared to "the goal of the final invoiced revenue for the corresponding period last year". The trend is against the current forecast of the 3 month period one month earlier - compared to the corresponding "period last year".